prettyBenching
A simple Deno library, that gives you pretty benchmarking progress and results in the commandline
⚠ The lib is in a very early stage of developement. Appeareance is likely to change until v1.0.0 of this lib ⚠
Getting started
Add the following to your deps.ts
export {
  prettyBenchmarkResult,
  prettyBenchmarkProgress
} from 'https://deno.land/x/pretty_benching@v0.0.1/mod.ts';
or just simply
import { prettyBenchmarkResult, prettyBenchmarkProgress } from 'https://deno.land/x/pretty_benching@v0.0.1/mod.ts';Note
Using Deno’s --allow-hrtime flag when running your code will result in a more precise benchmarking, because than float milliseconds will be used for measurement instead of integer.
prettyBenchmarkProgress
Prints the Deno runBenchmarks() methods progressCb callback values in a nicely readable format.
Usage
Simply add it to runBenchmarks() like below and you are good to go. Using silent: true is encouraged, so the default logs don’t interfere
await runBenchmarks({ silent: true }, prettyBenchmarkProgress())The output would look something like this during running:

End when finished:

Thresholds
You can define thresholds to specific benchmarks and than the times of the runs will be colored respectively
const threshold = {
  "for100ForIncrementX1e6": {green: 0.85, yellow: 1},
  "for100ForIncrementX1e8": {green: 84, yellow: 93},
  "forIncrementX1e9": {green: 900, yellow: 800},
  "forIncrementX1e9x2": {green: 15000, yellow: 18000},
}

runBenchmarks({ silent: true }, prettyBenchmarkProgress({threshold}))
prettyBenchmarkResults
Prints the Deno runBenchmarks() methods result in a nicely readable format.
Usage
Simply call prettyBenchmarkResult with the desired settings.
With precision you can define, into how many groups should the results be grouped when displaying a multiple run benchmark result
Use the silent: true flag in runBenchmarks, if you dont want to see the default output
// ...add benches...

runBenchmarks()
.then(prettyBenchmarkResult())
.catch((e: any) => {
  console.log(red(e.benchmarkName))
  console.error(red(e.stack));
});
or
// ...add benches...

runBenchmarks({silent: true})
.then(prettyBenchmarkResult({precision: 5}))
.catch((e: any) => {
  console.log(red(e.benchmarkName))
  console.error(red(e.stack));
});
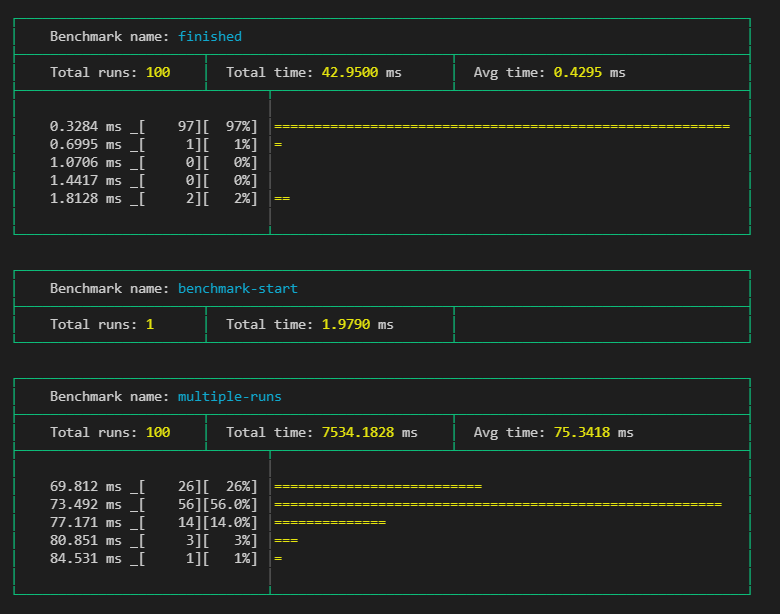
The output would look something like this:

Thresholds
You can define thresholds to specific benchmarks and than the times of the runs will be colored respectively
const thresholds = {
  "for100ForIncrementX1e6": {green: 0.85, yellow: 1},
  "for100ForIncrementX1e8": {green: 84, yellow: 93},
  "forIncrementX1e9": {green: 900, yellow: 800},
  "forIncrementX1e9x2": {green: 15000, yellow: 18000},
}

runBenchmarks().then(prettyBenchmarkResult({ precision: 5, threshold }))
.catch((e: any) => {
    console.log(red(e.benchmarkName));
    console.error(red(e.stack));
  },
);


