prettyBenching
A simple Deno library, that gives you pretty benchmarking progress and results in the commandline
⚠ Appeareance is likely to change until v1.0.0 of this lib ⚠
![]()

![]()
Getting started
Add the following to your deps.ts
export {
  prettyBenchmarkResult,
  prettyBenchmarkProgress
} from 'https://deno.land/x/pretty_benching@v0.1.1/mod.ts';
or just simply
import { prettyBenchmarkResult, prettyBenchmarkProgress } from 'https://deno.land/x/pretty_benching@v0.1.1/mod.ts';Note
Using Deno’s --allow-hrtime flag when running your code will result in a more precise benchmarking, because than float milliseconds will be used for measurement instead of integer.
You can use nocolor in the options of both prettyBenchmarkProgress and prettyBenchmarkResult to turn off the coloring on the output.
It doesn’t interfere with the Deno’s fmt color settings.
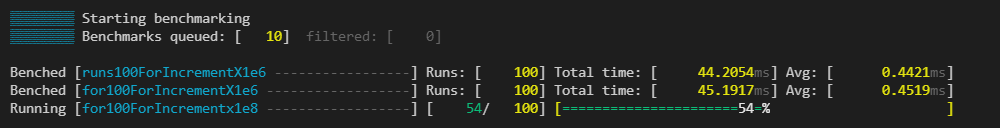
prettyBenchmarkProgress
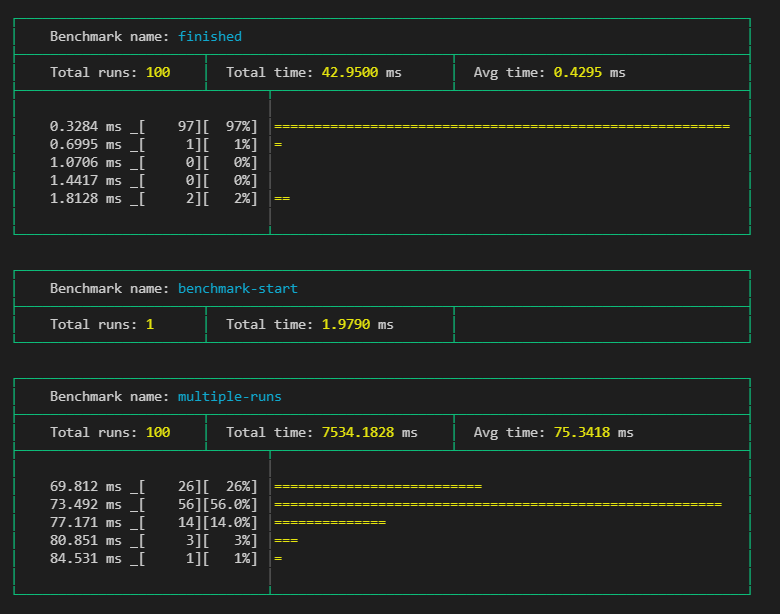
Prints the Deno runBenchmarks() methods progressCb callback values in a nicely readable format.
Usage
Simply add it to runBenchmarks() like below and you are good to go. Using silent: true is encouraged, so the default logs don’t interfere
await runBenchmarks({ silent: true }, prettyBenchmarkProgress())The output would look something like this during running:
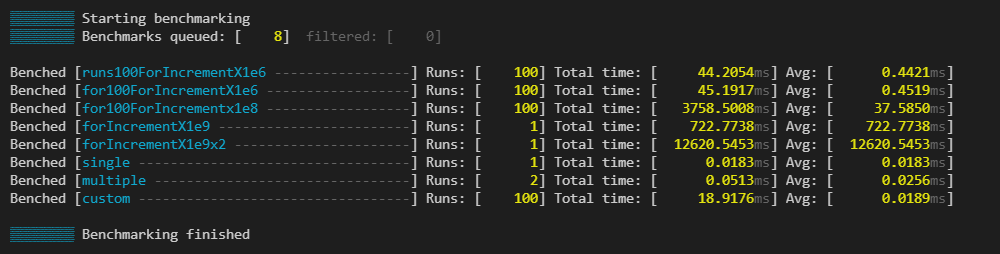
End when finished:
Thresholds
You can define thresholds to specific benchmarks and than the times of the runs will be colored respectively
const thresholds = {
  "for100ForIncrementX1e6": {green: 0.85, yellow: 1},
  "for100ForIncrementX1e8": {green: 84, yellow: 93},
  "forIncrementX1e9": {green: 900, yellow: 800},
  "forIncrementX1e9x2": {green: 15000, yellow: 18000},
}

runBenchmarks({ silent: true }, prettyBenchmarkProgress({thresholds}))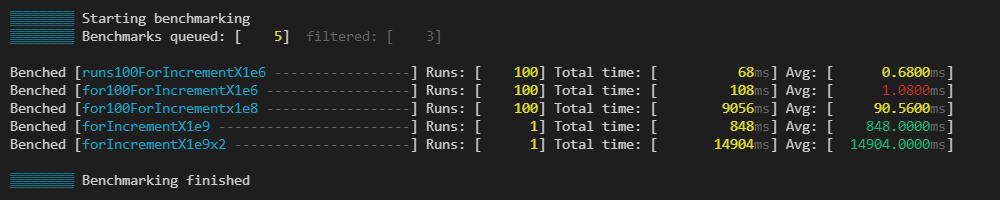
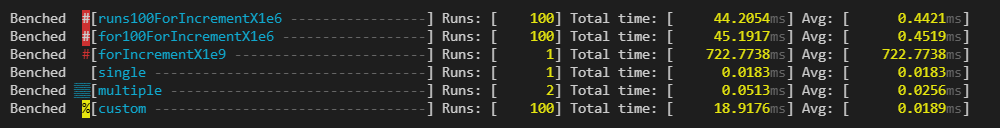
Indicators
You can use indicators, which help you categorise your benchmarks. You can change the character which gets added before the benchmark.
const indicators = [
  { benches: /100/, modFn: colors.bgRed },
  { benches: /for/, modFn: colors.red },
  { benches: /custom/, modFn: () => colors.bgYellow(colors.black("%")) }, // change "icon"
];
prettyBenchmarkResults
Prints the Deno runBenchmarks() methods result in a nicely readable format.
Usage
Simply call prettyBenchmarkResult with the desired settings.
Setting the nocolor option to true will remove all the built in coloring. Its usefull, if you log it somewhere or save the output to a file. It won’t interfere with Deno’s fmt color settings.
Use the silent: true flag in runBenchmarks, if you dont want to see the default output
// ...add benches...

runBenchmarks({silent: true})
.then(prettyBenchmarkResult())
.catch((e: any) => {
  console.error(e.stack);
});
The output would look something like this:
Thresholds
You can define thresholds to specific benchmarks and than related things, like times or graph bars will be colored respectively. This can use the same thresholds object as in prettyBenchmarkProgress.
const thresholds = {
      "multiple-runs": { green: 76, yellow: 82 },
      "benchmark-start": { green: 2, yellow: 3 },
};

runBenchmarks().then(prettyBenchmarkResult({ thresholds }));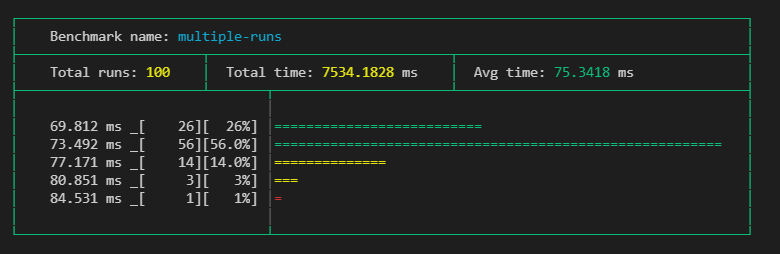
Indicators
You can use indicators, which help you categorise your benchmarks besides just their names. You can set what color the table should have. With modFn you can also change what color the marker should be, or even change the indicator icon like seen below (default is #).
You can pass this object to prettyBenchmarkProgress too.
const indicators = [
  {
    benches: /multiple-runs/,
    tableColor: colors.magenta,
    modFn: (str) => "🚀",
  }
];

runBenchmarks().then(prettyBenchmarkResult({ indicators }));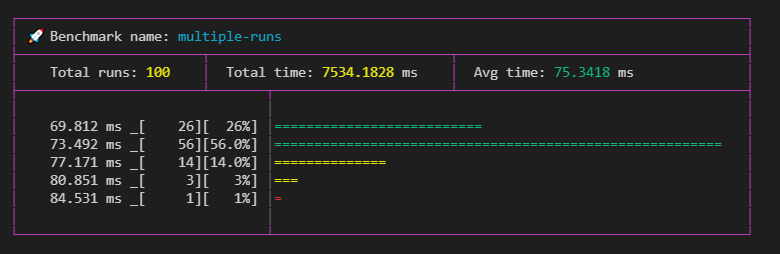
Parts
You can change what the result cards should contain with the parts object. Once you define it you have to set all parts you want. The default parts setting is { graph: true, graphBars: 5 }.
You can define what parts you want to use in the options, like this:
prettyBenchmarkResult(
      {
        nocolor: false,
        thresholds,
        indicators,
        parts: {
          extraMetrics: true,
          threshold: true,
          graph: true,
          graphBars: 10,
        },
      },
    )
Using all options:
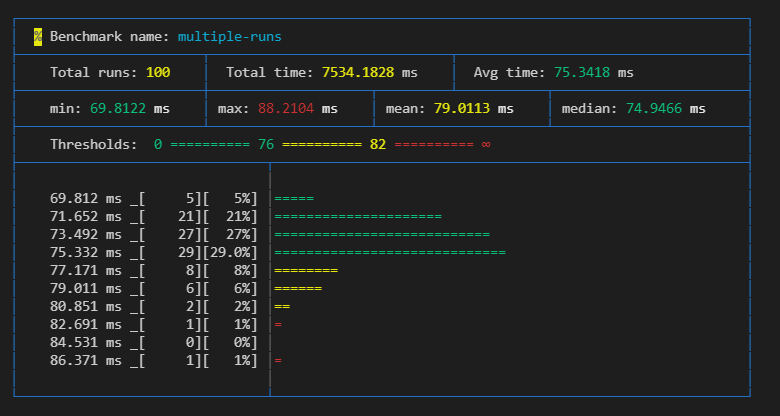
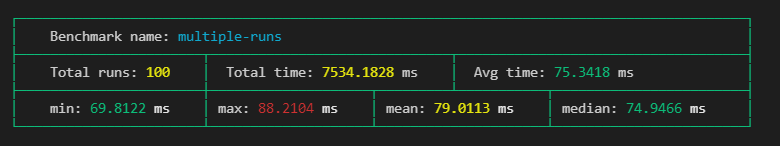
Extra metrics { extraMetrics: true }
Setting this will give you an extra row, which adds extra calculated values like min, max, mean as ((min+max)/2) , median.
Threshold { threshold: true }
Need to have
thresholdsin the root which have a matching threshold for the specific benchmark, otherwise it wont add it to the specific card.
It simply show what the set thresholds for the benchmark. Can be usefull if nocolor is set to true.
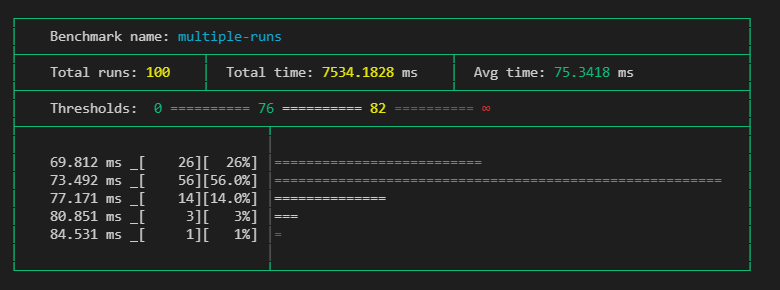
Graph { graph: true, graphBars: 5 }
Adds a graph, which shows the distribution of the runs of the benchmark.
Only shows, when there are
10or more runs set.
The graph shows the results groupped into timeframes, where the groups frame start from the value on the head of its line, and end with excluding the value on the next line.
With graphBars you can set how many bars it should show. Default is 5.
Roadmap
BenchmarkProgress
- Add
indicatoroptions - Add
nocoloroption - Add overridable output function like in benchmark results
BenchmarkResults
- Overrideable output function
- Refactor outputting result in a single call
- Add
nocoloroption - Fix graph
- Add
indicatoroptions like in progress - Tidy up current benchmark results look
- Add options to define what parts are shown in the result cards. (eg. show graph, more calculated values like mean, …)
- Find a place in
extraMetricsforstandard deviation. - Add option to crop outlayer results from graph (maybe with a percent limit).
- Add an option to have a minimalist result output, that resembles the final progress output, instead of the big cards.
Historic data
- Add module to enable historic data save/read inside repo
- Make use of historic module, enable automatic calculating of thresholds from previous runs
- Option to use historic data, to tell if benchmarks got better or worse from previous runs.
Operational
- Write README docs
- Separate
prettyBenchmarkResultsandprettyBenchmarkProgressinto independently importable modules. - Add the ability to follow the change on how the outputs look like.
- Refactor how optional
optionsare handled - Proper tests
- Write JSDocs
- Refactor README
- Add showcase module, which helps to have consistent docs images
- Make module contributor friendly